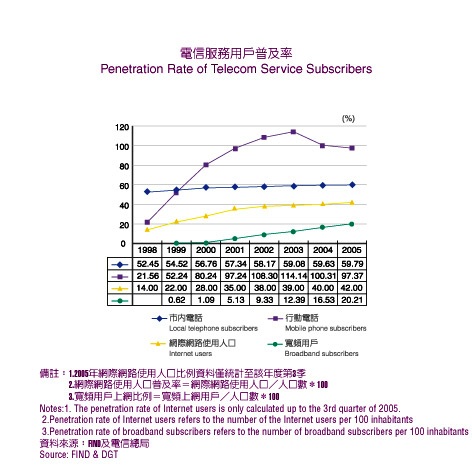
Penetration Rate of Telecom Service Subscribers

Penetration Rate of Telecom Service Subscribers
|
Year
|
Local telephone subscribers
(%)
|
Mobile phone subscribers
(%)
|
Internet users
(%)
|
Broadband subscribers
(%)
|
|
1998
|
52.45
|
21.56
|
14.00
|
0
|
|
1999
|
54.52
|
52.24
|
22.00
|
0.62
|
|
2000
|
56.76
|
80.24
|
28.00
|
1.09
|
|
2001
|
57.34
|
97.24
|
35.00
|
5.13
|
|
2002
|
58.17
|
108.30
|
38.00
|
9.33
|
|
2003
|
59.08
|
114.14
|
39.00
|
12.39
|
|
2004
|
59.63
|
100.31
|
40.00
|
16.53
|
|
2005
|
59.79
|
97.37
|
42.00
|
20.21
|
Note:
- The penetration rate of internet users is only calculated up to the 3rd quarter of 2005.
- Penetration rate of internet users refers to the number of the internet users per 100 inhabitants.
- Penetration rate of broadband subscribers refers to the number of broadband subscribers per 100 inhabitants.
Source:FIND&DGT