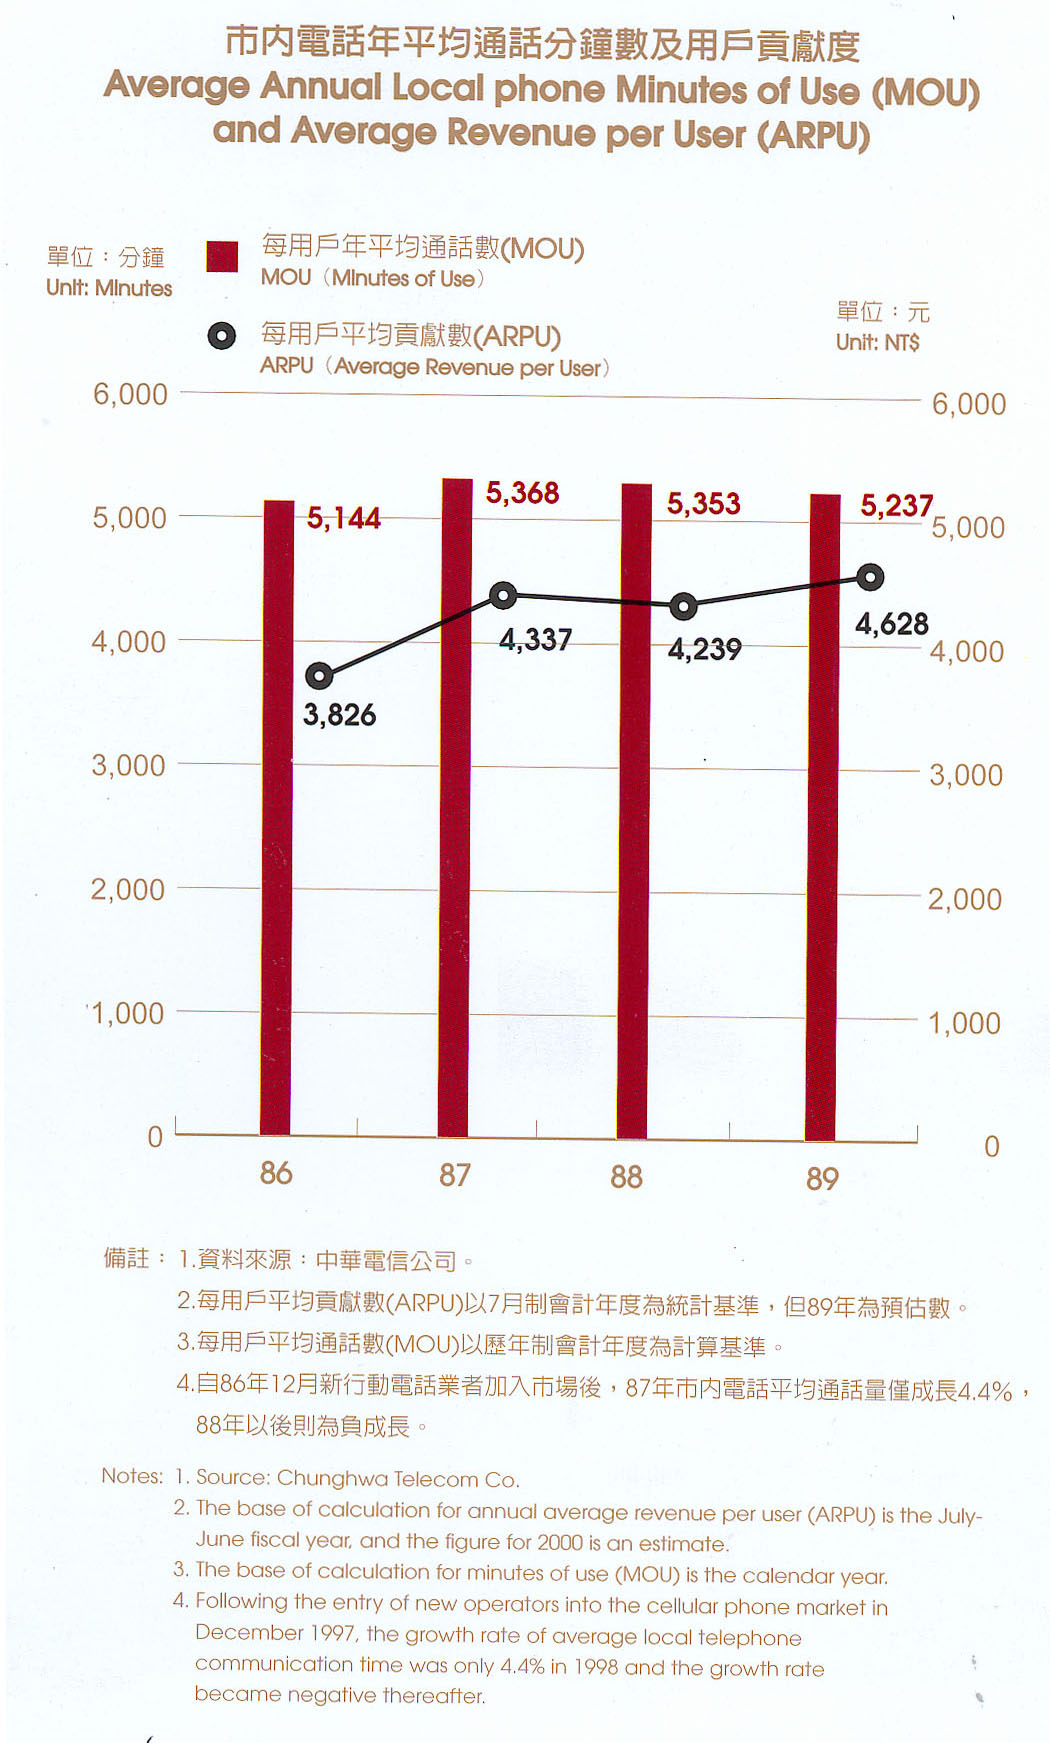
Average Annual Local phone Minutes of Use (MOU) and Average Revenue per User(ARPU)

Average Annual Local phone Minutes of Use (MOU) and Average Revenue per User(ARPU)
| Year |
MOU(Minutes of Use)
(Unit:Minutes) |
ARPU(Average Revenue per User)
(Unit:NT$) |
| 1997 |
5,144 |
3,826 |
| 1998 |
5,368 |
4,337 |
| 1999 |
5,353 |
4,239 |
| 2000 |
5,237 |
4,628 |
Note:
- Source:Chunghwa Telecom Co.
- The base of calculation for annual average revenue per user (ARPU) is the July-June fiscal year,and the figure for 2000 is an estimate.
- The base of calculation for minutes of use (MOU) is the calendar year.
- Following the entry of new operators into the cellular phone market in December 1997,the growth rate of average local telephone communication time was only 4.4% in 1998 and the growth rate became negative thereafter.